Energy density: why the same calorie count can mean different amounts of food
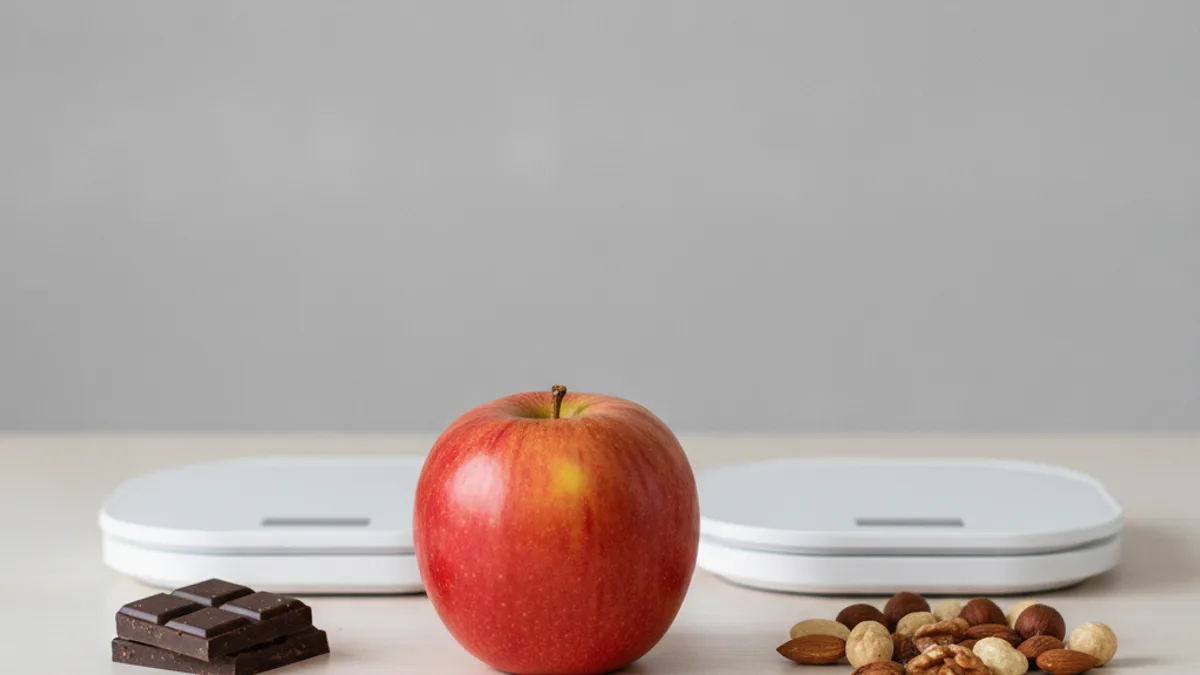
Energy density is calories per gram, and it is already printed on every package: that very line "per 100 g" that people usually overlook while searching for the per-serving figure. It determines how much food fits into your daily calorie allowance.
What this parameter is
Energy density is the calorie content per unit of mass. The "kcal per 100 g" line on a package is exactly that: 540 kcal per 100 g for chocolate versus 40 for an apple means that for the same calorie count, you would have thirteen times more food by weight with apples.
Your daily allowance is set in calories, while the feeling of fullness is related, among other things, to the volume and mass of what you eat. Two days with the same number in your food diary can differ in the amount of food by several times.
What determines density
Regulations establish coefficients used to calculate calorie content (Annex 4 to TR TS 022/2011):
| Substance | kcal per gram |
|---|---|
| Fats | 9 |
| Ethanol | 7 |
| Proteins | 4 |
| Carbohydrates | 4 |
| Organic acids | 3 |
| Dietary fiber | 2 |
| Erythritol | 0 |
Water is not in the table, and this is key: it has weight but provides no calories at all. Therefore, a product's density is determined by two numbers—the fat content, which increases it, and the water content, which decreases it. Fiber works to lower density on both fronts: it provides 2 kcal/g itself and retains water, which is discussed in more detail in our article on fiber.
A practical consequence: soup and a casserole made from the same ingredients differ in density, even though the composition is identical. Dried food differs from fresh for the same reason—water has been removed from raisins, so the calorie count per 100 g has tripled, even though the grapes themselves remain the same.
What the studies showed
A meta-analysis of 31 studies (90 comparisons, 27 involving adults and 4 involving children) collected experiments where people were given food that looked the same but had different energy density, and researchers observed how much they ate.
Reducing density noticeably decreased consumption: standardized mean difference −1.00 (95% CI from −0.75 to −1.27). In terms of calories, the effect depended on whether the density was changed for all food or only for a portion:
- all meals changed — −856 kcal per day (95% CI from −616 to −1096);
- individual meals changed — −238 kcal per day (95% CI from −148 to −328).
The second number is more important than the first: it is closer to what happens when a person changes one or two products rather than their entire diet. It also highlights a limitation of the method: people partially compensated for the deficit by eating more of the foods whose density was not changed.
What the meta-analysis did not show: the difference in weight change between groups was −0.69 kg and did not reach statistical significance (95% CI from −1.43 to +0.04). In other words, it measured the impact on the amount consumed, not a guaranteed result on the scale.
Where to find this parameter
You do not need to calculate it. It is printed on every package in the "per 100 g" line and appears in the product card when scanning a barcode. The difference between two versions of the same product is visible immediately, without reading the fine print or doing any math.
It makes sense to compare comparable items: two types of bread, two yogurts, or two types of nuts. Comparing yogurt with butter does not provide a solution because they are not interchangeable on the plate. Why the numbers on the package are not absolute is explained separately.
How to use it
This parameter explains where the portion volume comes from. Three observations follow from this:
- Replacing items within a category changes volume more than eliminating the category entirely. The same weight of a dish with a different sauce results in a different density and a different number in your log.
- Water added to a dish during cooking reduces density but not the calorie content of the portion: you eat more soup by weight, but it contains the same number of calories as the ingredients used to make it.
- A high-density product does not require exclusion. It requires tracking: 30 g of nuts and 300 g of salad take up a comparable amount of space in your daily intake.
What full daily meal plans look like for different targets is shown in a separate article.
What density does not explain
It is not a measure of healthfulness. Olive oil and margarine are similar in density, as are a powdered drink and water, but they differ in other ways. Classification by degree of processing addresses a different task and is analyzed in the article about NOVA.
It is not the only factor that affects appetite. Protein and fiber influence satiety independently of portion mass, and evening hunger is often explained not by the composition of dinner, but by what happened during the day — there is a separate analysis on the causes of sugar cravings.
And it says nothing about a specific individual. The meta-analysis measured group averages; how much portion volume affects your satiety can only be seen through your own logs over a couple of weeks.
Frequently asked questions
- What is the energy density of a product?
- The calorie content per unit of mass, i.e., the "kcal per 100 g" line on the package. Chocolate has about 540 kcal per 100 g, while an apple has about 40: for the same calorie count, you get about thirteen times more apple by weight.
- What does energy density depend on?
- On the proportion of fat and water. According to Appendix 4 of TR TS 022/2011, fats provide 9 kcal/g, proteins and carbohydrates 4 kcal/g each, dietary fiber 2 kcal/g, while water provides no calories at all, yet it makes up the bulk of the mass of many products.
- Does reducing energy density help you eat less?
- In a meta-analysis of 31 studies, reducing density decreased daily intake by 856 kcal when all food was changed, and by 238 kcal when individual meals were changed. The difference in weight change between groups did not reach statistical significance.
- Does high density mean a product is unhealthy?
- No. It is a parameter of mass and volume, not healthfulness: olive oil and margarine are similar in density. A high-density product does not require exclusion; it requires being accounted for in your daily intake.
- Where can I see this indicator?
- It is already printed in the "per 100 g" line and appears on the product card when scanning a barcode. It makes sense to compare similar products: two types of bread, two yogurts.
Read next
- 1200, 1500, and 2000 kcal: how much food is that in grams — The daily calorie allowance is an abstraction until you see it in grams.
- Fiber: what it does in the gut and how much you need — We know that we "need more" fiber, but that is usually where the conversation ends: it is unclear what it physically does, why it causes bloating, and where the 25–30 grams per day recommendation comes from.
- Calories and macros on the label: why the numbers don't match reality — The same buckwheat in three different apps gives three different calorie counts, and the package shows a fourth.
- Holiday table: where do the calories in Olivier and herring under a fur coat come from — Olivier salad does not have one correct number: one cook's version may have twice as many calories as another's, despite using the same ingredients.
This article is for general information. It is not medical advice, a diagnosis, or a prescription for treatment or a diet, and it does not replace a consultation with your doctor. If you have a health condition, are pregnant, take medication, or follow a diet prescribed to you, decisions about food belong with your doctor.
Figures from regulations, guidelines and studies are given as they stood when this article was prepared and may since have changed; check them against the primary sources. This article is not advertising, an offer, or individual advice, and neither the author nor the site owner is responsible for decisions taken on the basis of it.