Where there is more sugar than in cola: an analysis of 34,000 products on Russian shelves
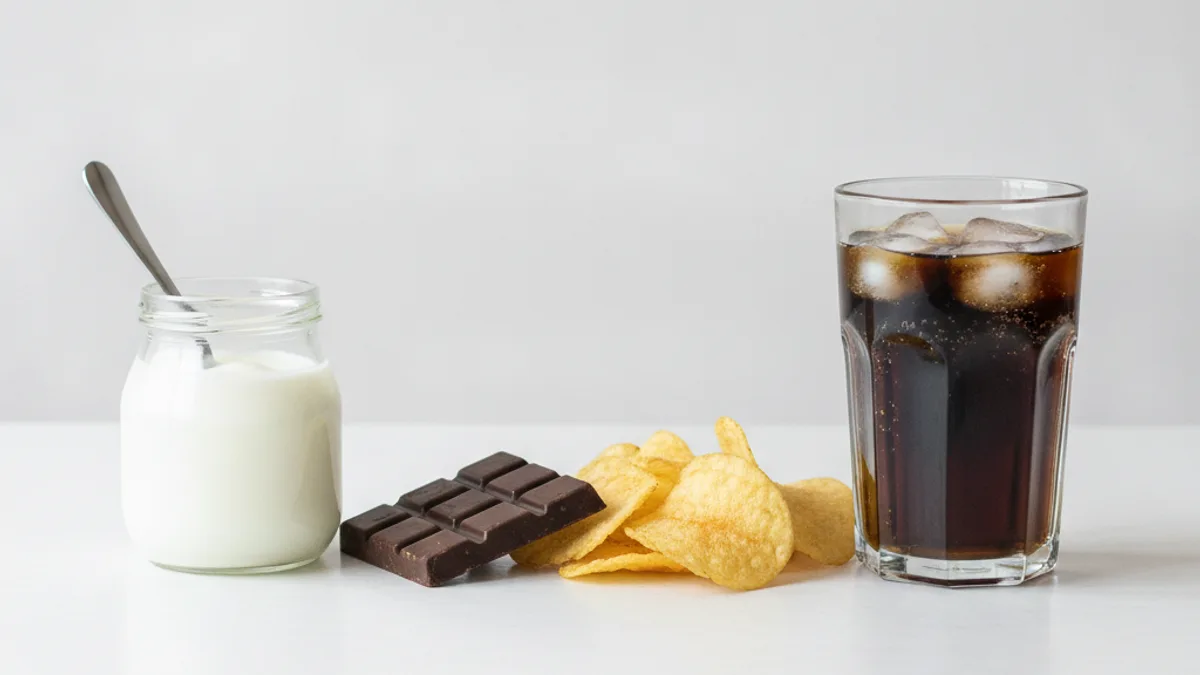
We took an open dataset from Open Food Facts—four and a half million products—and calculated how much sugar is in what is sold in Russia. There are two conclusions: one about sugar, and the other about the fact that there is almost no data on it.
How the calculations were made
The source is an open data dump from the Open Food Facts database, the same dataset used to build the mirror for barcode searches. In total, it contains 4,535,553 products from all over the world.
We selected 34,422 products labeled as "sold in Russia," took the "sugars per 100 g" field, and compared it to classic cola: in the same database, it has 10.6 g of sugar per 100 ml at 42 kcal.
We tried filtering by Cyrillic in the name but abandoned it: such a selection includes Bulgarian, Serbian, and Ukrainian products—"sladko ot malini" (raspberry jam) and "leshnikov krem" (hazelnut cream) have nothing to do with the Russian shelf. The country label is stricter and more accurate, even though the sample size is smaller.
Another limitation: data is entered by users, and the database is more likely to contain items that someone has scanned in a store. Therefore, what follows are medians by category, not a ranking of specific products.
First takeaway: there is almost no data
| Field | Filled for products labeled "Russia" |
|---|---|
| Sugars per 100 g | 605 out of 34,422 (1.8%) |
| Caloric content | 1,753 (5.1%) |
| Salt | 494 (1.4%) |
For comparison: for products labeled "France," sugar data is available for 875,687 out of 1,263,864—that is 69%.
The difference between 1.8% and 69% is not a property of the products, but a property of the database: in France, it has been populated for a decade and a half, while in Russia, it is barely used.
The consequence for any app with a barcode scanner is this: for a Russian product, the open database is most often silent, and the figure has to be obtained from elsewhere. How barcode search works is covered in our article on barcodes on packaging, and where numbers in apps come from in general is explained in our article on product databases.
Second takeaway: sugar
Among the 605 products for which data is available, 40.7% contain more sugar per 100 g than cola. The median for the sample is 7.3 g, but the distribution is skewed: a quarter of the products start from 27 g, and a tenth start from 51 g per 100 g.
| Category | Median, g/100 g | Products | Above cola |
|---|---|---|---|
| Confectionery | 50.5 | 52 | 96% |
| Chocolate | 50.0 | 49 | 94% |
| Chocolate candies | 49.0 | 29 | 100% |
| Sweet snacks | 42.0 | 128 | 95% |
| Bars | 41.1 | 26 | 100% |
| Cookies | 29.3 | 30 | 97% |
| Desserts | 7.7 | 91 | 26% |
| Yogurts | 7.3 | 69 | 10% |
| Dairy products | 6.9 | 105 | 18% |
| Beverages | 4.4 | 83 | 8% |
| Chips and beer snacks | 2.4 | 25 | 0% |
What is interesting in this table
The top rows are predictable, and that is not the point. The fact that half the mass of chocolate is sugar is no surprise.
Yogurts. A median of 7.3 g per 100 g is two-thirds the level of cola, even though cola is considered a sugary drink and yogurt is considered a healthy product. In a standard 125 g container, this is about 9 g of sugar, or two teaspoons.
Chips vs. yogurt. The most counterintuitive pair in the sample: the median sugar content in chips is 2.4 g, three times lower than in yogurts, and not a single product in the category exceeded the level of cola. This does not make chips healthier: they have a different problem—fat and salt, which is discussed in the article on salt in processed food.
Beverages. The median of 4.4 g is lower than cola because the category includes water, unsweetened tea, and drinks with sweeteners. Averages for the "beverages" category generally say little: the variance within it is maximal.
What to do with this in the store
- Look at the "of which sugars" line, not the name. "Fitness," "eco," and "no added sugar" labels say nothing about it—see our separate article on this.
- Compare against a benchmark, not zero. The WHO recommends keeping free sugars below 10% of daily energy intake—this is their guideline on sugar intake. For a 2,000 kcal diet, this is about 50 g per day.
- Check the specific package, not the category. The median is a guide; within any category, the variance can be significant.
- Remember that "healthy" does not mean "sugar-free." Yogurts, curd snacks, and milk-based desserts are the most underestimated row in the table.
Under what names sugar hides in ingredients—see our article on hidden sugar. The fastest way to check your package is with a scanner: if the product is not in the database—and according to our own data, this is the most likely outcome—the ingredients can be read directly from the label.
Frequently asked questions
- Which products contain more sugar than cola?
- Based on our sample from Open Food Facts, 100% of chocolate candies and bars, 96% of confectionery, 97% of cookies, and 95% of sweet snacks exceeded the level of cola (10.6 g per 100 g). In total, 40.7% of products with available data exceed this threshold.
- How much sugar is in yogurt?
- The median for the category is 7.3 g per 100 g, which is about 9 g per 125 g container. This is two-thirds the level of cola, and one in ten yogurts in the sample exceeds it.
- Why is there no data on Russian products in the databases?
- Open Food Facts is populated by users. For products labeled "Russia," sugar data is available for 1.8% and calorie data for 5.1%; for French products, sugar data is filled in for 69%.
- Can these numbers be trusted?
- This is user-provided data, not laboratory measurements, and the sample is biased toward scanned products. Therefore, the material presents medians by category with the sample size indicated, rather than ratings of individual products.
- How much sugar is acceptable per day?
- The WHO recommends limiting free sugars to 10% of daily energy intake, with a reduction to 5% cited as a conditional recommendation. For a 2000 kcal diet, 10% is about 50 g.
Read next
- Hidden sugar: under what names it appears in ingredients — The word "sugar" appears in ingredients less often than sugar itself does in a product: it has a dozen legal names, and the manufacturer has every right to use any of them.
- "Sugar-free," "fitness," "eco": what these labels actually mean — The front of a package speaks in short words: "light," "fitness," "sugar-free," "eco.
- Where do apps get calorie and macronutrient data and why do the numbers differ — The same cottage cheese gets different calorie counts in two apps, and people usually assume one of them is wrong.
This article is for general information. It is not medical advice, a diagnosis, or a prescription for treatment or a diet, and it does not replace a consultation with your doctor. If you have a health condition, are pregnant, take medication, or follow a diet prescribed to you, decisions about food belong with your doctor.
Figures from regulations, guidelines and studies are given as they stood when this article was prepared and may since have changed; check them against the primary sources. This article is not advertising, an offer, or individual advice, and neither the author nor the site owner is responsible for decisions taken on the basis of it.