Where do apps get calorie and macronutrient data and why do the numbers differ
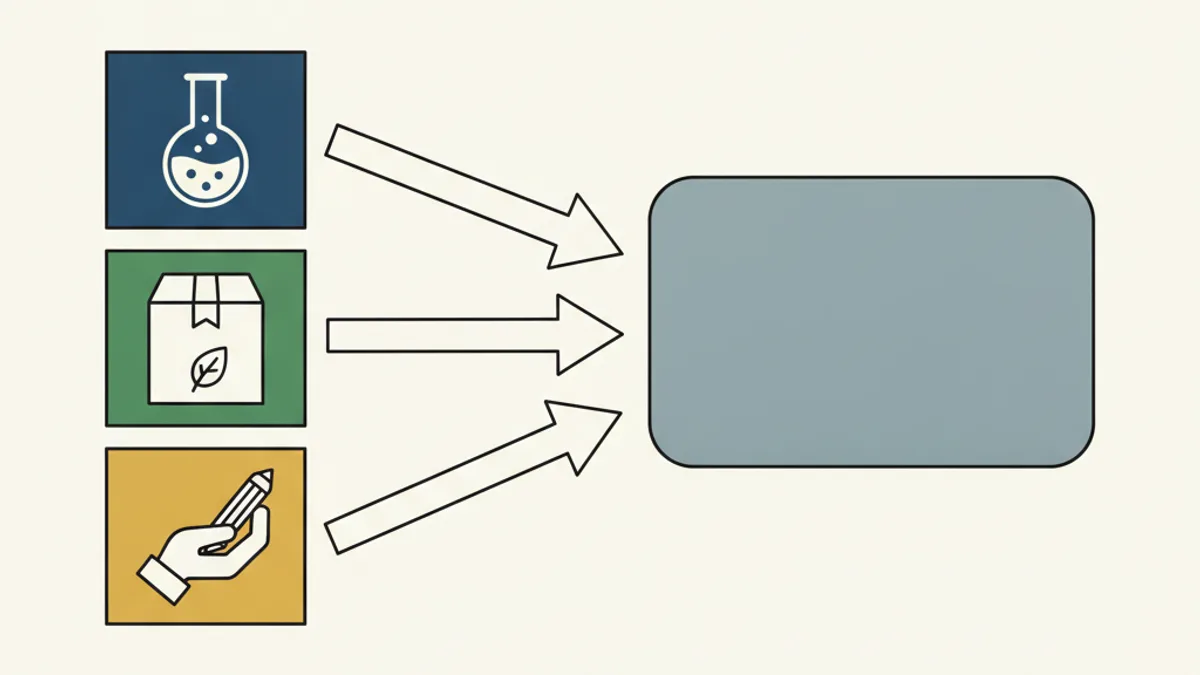
The same cottage cheese gets different calorie counts in two apps, and people usually assume one of them is wrong. Most often, neither is wrong: apps use different sources, and each source is correct in its own way. It is worth understanding this, if only to know which entry to choose from a dozen similar ones.
Three different sources under the word "database"
There are three types of data behind the calorie counts in an app, and it is important not to confuse them.
| Source | How values are obtained | Weak point |
|---|---|---|
| Laboratory reference | Chemical analysis of samples, averaging across a sample set | Generalized product, not yours; updates slowly |
| Label data | Transfer of declared values from packaging | Inherits all tolerances of the manufacturer's statement |
| User entries | Manually entered by app users | Typos, confusion between "per 100 g" and "per serving", duplicates |
Most apps mix all three and do not visually distinguish them in the search results. This is why you see a dozen "cottage cheese 5%" entries with different numbers: some rows are from a reference database, some are from various brand labels, and some were entered by people.
Laboratory reference databases
This is the source layer from which everything else is derived. The values are obtained by analyzing samples: nitrogen is converted into protein, fat is extracted with a solvent, ash and moisture are determined by drying and burning, and carbohydrates are often calculated by difference. Calorie content is not measured directly but is calculated using coefficients—approximately 4 kcal per gram of protein and carbohydrates, and 9 per gram of fat.
The strength of such a source is traceability: every number has a method and a sample set. The weakness is generalization. "Beef, boiled" in a reference database describes an average sample, not the piece on your plate: the fat content in meat depends on the cut and the animal's diet and can vary significantly.
There is also the question of the quality of the reference databases themselves. An analysis of data in nutrient databases identifies completeness—how many nutrients are defined for an item—as the main indicator, and the suitability of the data for machine processing as the second. Gaps in tables are common and are usually filled in silently.
Label data
The second layer is what the manufacturer printed on the packaging. Its advantage is specificity: this is your exact product, not an average. The disadvantage is that the declared values have a tolerance and are calculated based on a recipe rather than measured in every batch. This is discussed in detail in the article Nutritional value on packaging.
Such data is collected in different ways. There are industry and national projects where entries are created from photos of packaging; there are open projects where information is entered by participants and consumers. A description of one such open repository of products with barcodes shows both the general approach and the common problem: shelf coverage depends on who and in which country takes on the task of entering the data.
For the Russian market, this is noticeable. International open databases cover it selectively, private label brands of retail chains are almost not covered at all, and for many barcodes, there is simply no entry. What happens in this case and why the code is still read normally is discussed in the article about barcodes.
Entries made by people
The third layer is the largest and the noisiest. Its typical defects are the same in all apps:
- Confusion between "per 100 g" and "per serving". The most costly error: an entry where serving values are labeled as "per 100 g" underestimates or overestimates everything by several times.
- Duplicates. One product under five names, including Latin script and typos.
- Outdated recipes. The entry was made five years ago, and the composition has changed since then.
- Adjustment. Values entered "for oneself" to make the diary balance.
Direct checks of this kind of data exist. A comparison of the databases of two popular apps with a research database showed good agreement on energy and most nutrients for one of them and noticeably worse agreement on specific product groups and individual nutrients for the other—in particular, fat and fiber. A separate check of five popular apps found a systematic underestimation of calories and macronutrients relative to a reference database.
Why this is less noticeable than it seems
The spread between databases is real, but compared to other sources of error, it is not the main one. The error in estimating portion weight is usually larger—according to published checks, it is measured in tens of percent—while the difference between two decent entries for the same product usually falls within 5–15%. For more on where the weight error comes from, see the article on food recognition by photo.
Hence a simple rule of priorities: first learn to get the weight right, then be picky about the database. The reverse order gives neat numbers with incorrect grams.
How to choose an entry from a dozen
- Give preference to an entry with a full breakdown. If proteins, fats, carbohydrates, and calories are specified and they align with the 4-4-9 coefficients, the entry is likely not made up.
- Check the unit. "Per 100 g" or "per serving" is the first thing to look at and the most common cause of significant errors.
- Prefer a brand over a generalization. For a packaged product, an entry with the manufacturer's name is more accurate than a generic "boiled sausage".
- For homemade food, take a generalization. Here it is the opposite: your borscht has its own recipe, and a generic entry is more honest than someone else's branded one. How to calculate this is discussed in the article about calories in homemade food.
- Stick to one entry. If you eat the same product every day, consistency is more important than absolute accuracy: the bias will be the same every day and will not prevent you from comparing them with each other.
Frequently asked questions
- Why does the same product have different calorie counts in different apps?
- Because the sources differ: a laboratory database provides an average value based on a sample set, label data is a claim by a specific manufacturer, and user entries are added manually and often contain typos or unit confusion. All three layers are usually mixed together in a single list of results.
- Which entry should I trust if there are a dozen of them?
- The one that provides a full breakdown of proteins, fats, and carbohydrates that aligns with the 4-4-9 calorie coefficients, and where it is clearly stated whether the values are per 100 g or per serving. For packaged products, the entry with the brand name is more accurate; for home-cooked food, a generic entry is better.
- How much does database discrepancy affect tracking?
- Less than errors in portion weight. The difference between two decent entries for the same product usually falls within 5–15%, whereas the error in estimating weight by eye is measured in tens of percent.
- Why are Russian products often missing from the database?
- Open databases are populated by users, and coverage depends on who contributes data in a specific country. The Russian market is covered selectively, and private-label store brands are almost entirely absent. The barcode will scan correctly, but there is simply no entry for it.
- What should I do if a product is not in any database?
- Use the values from the packaging—this is the primary source for a finished product. For a home-cooked dish, calculate it based on ingredients and weight rather than searching for a similar ready-made item: recipes vary more than databases.
Read next
- Barcode on packaging: what is encrypted in it and what is not — There is a persistent belief about barcodes: that you can supposedly tell the country where a product was made from the first digits, and verify its authenticity from the rest.
- Calorie counting apps: how they work and where they go wrong — A calorie counter looks like a calculator, and people expect calculator-like precision from it.
- Calories and macros on the label: why the numbers don't match reality — The same buckwheat in three different apps gives three different calorie counts, and the package shows a fourth.
This article is for general information. It is not medical advice, a diagnosis, or a prescription for treatment or a diet, and it does not replace a consultation with your doctor. If you have a health condition, are pregnant, take medication, or follow a diet prescribed to you, decisions about food belong with your doctor.
Figures from regulations, guidelines and studies are given as they stood when this article was prepared and may since have changed; check them against the primary sources. This article is not advertising, an offer, or individual advice, and neither the author nor the site owner is responsible for decisions taken on the basis of it.