Glucose monitoring without diabetes: what the sensor on your arm shows
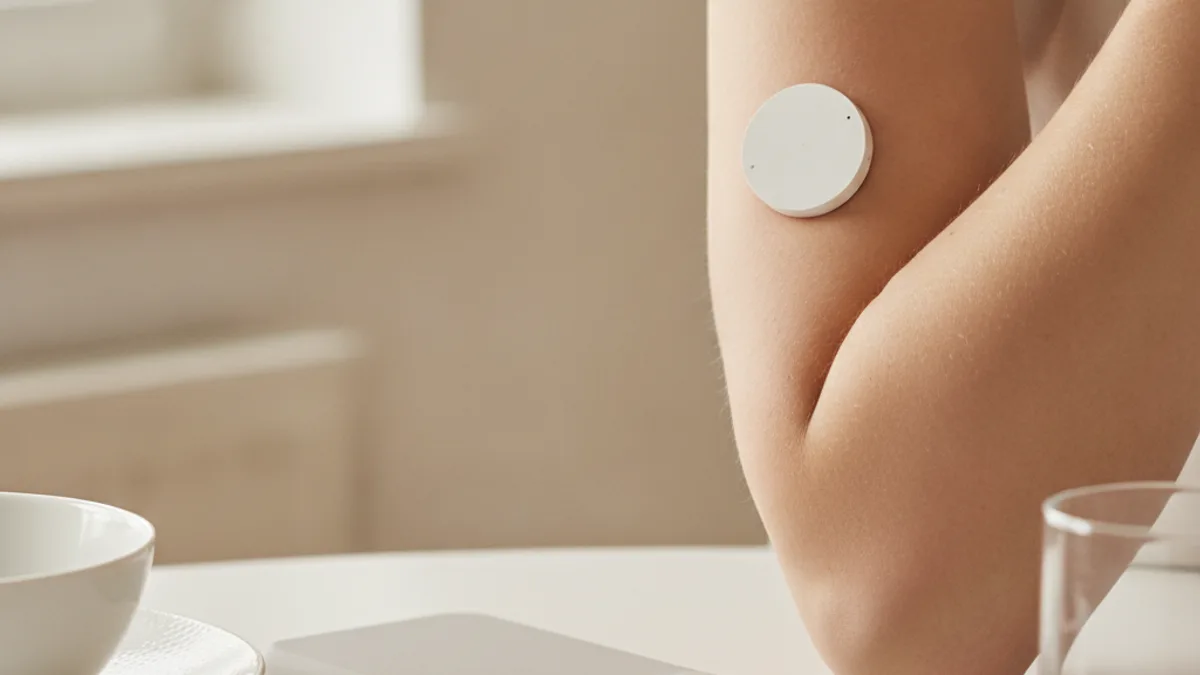
A coin-sized sensor on the shoulder and a blood sugar graph on a phone are no longer exclusive to diabetes: people without a diagnosis are using them to "understand their reaction to food." However, the graph does not show exactly what is expected, and the range of what is considered normal is wider than commonly thought.
What is actually being measured
A thin, enzyme-coated filament is inserted under the skin. Glucose from the interstitial fluid reacts, the reaction produces an electrical signal, and the signal is converted into a concentration value. The device operates continuously and provides a reading every few minutes.
Two clarifications that change how you read the graph.
It is not blood. Interstitial fluid receives glucose from capillaries with a delay, which is about ten to fifteen minutes. The peak on the graph appears after the actual peak in the blood, and the discrepancy is especially noticeable during rapid changes.
It is an estimate, not a laboratory analysis. The accuracy of consumer sensors is designed for diabetes management, where large deviations are important, and manufacturers state it as a mean absolute relative difference. For comparing two breakfasts that differ by a tenth of a millimole, this accuracy is insufficient.
What is considered normal for a person without diabetes
The expectation that "a healthy person's sugar is flat" is incorrect: it fluctuates for everyone, and the only question is the range.
A large study of 4,135 participants without diabetes provides these benchmarks: the median variability is about 15%, people spent about 96% of their time in the internal range of 3.9–7.8 mmol/L, and about 75% of the time in the narrower 3.9–5.6 mmol/L range. That is, for a quarter of the day, values fall outside the narrow corridor, and this is a picture of normalcy, not a deviation.
A separate study on reference values in people without diabetes or prediabetes also notes that the proportion of time spent with low values in healthy individuals is not zero.
The practical conclusion is simple: for a person without diabetes, a single rise after a meal to 8 mmol/L is not a deviation in itself. The overall picture over 24 hours and its stability matters, not a single point—and if the picture is concerning, the issue should be resolved with a blood test and a doctor, not a sensor.
Why the graph looks scary after eating
A rise in glucose after a carbohydrate-rich meal is normal metabolic function, not a breakdown. Consumed starch is broken down into glucose, it enters the blood, insulin moves it into cells, and the level returns to normal. The steepness and height of the peak depend on what is eaten and with what—roughly the same factors that determine the glycemic index: the amount and type of carbohydrates, the presence of fat and protein, fiber, the degree of processing, and temperature.
Reading errors arise due to the scale. The app stretches the vertical axis based on your own data, and a rise from 4.8 to 7.2 takes up half the screen, looking like a spike. The same rise on an axis from zero to twenty would be barely noticeable.
What the sensor actually provides for a person without diabetes
There is less utility here than the marketing promises, but it is not zero.
- Portion visualization. The difference between 100 grams of rice and 300 is clearly visible on the graph. This is the same lesson provided by estimating portion weight, but it arrives faster.
- Visibility of liquid carbohydrates. Juice and sweetened coffee cause a sharper rise than the same energy in solid form.
- The effect of food order and composition. The same carbohydrates eaten with protein and vegetables result in a flatter curve than when eaten alone.
- Feedback on movement. A walk after a meal noticeably smooths out the rise.
Everything listed is known even without a sensor; the value of the device is that it turns general knowledge into personal observation. For some people, this works as motivation, and in that capacity, it is honest.
What it does not provide
A diagnosis. Diabetes and prediabetes are diagnosed via venous blood and glycated hemoglobin, not by a consumer sensor. A concerning picture is a reason to get a test, not a conclusion.
A personalized diet. The temptation to exclude everything that causes a rise leads to a diet of meat, fats, and greens. A rise is not harmful; excluding entire food groups has its own cost, which is discussed in the article on diets.
An answer about calories. The glucose curve is not about energy: fatty food barely moves the graph and is the most caloric. By focusing on the sensor, it is easy to eat more than necessary without seeing it. Energy balance is still calculated separately—this is covered in the material on calorie deficit.
How to read the graph if you are already using one
- Look at the return, not the height. It is more important whether the value returned to the baseline after two hours than what the peak was.
- Compare only comparable things. The same breakfast on different days is meaningful. Breakfast vs. dinner is not.
- Remember the delay. The peak on the screen lags by 10–15 minutes; the decline after physical activity does as well.
- Do not change your diet based on one day. The curve is influenced by sleep, stress, illness, the menstrual cycle, coffee, and heat—not just food. There is a separate article on sleep and metabolism: sleep deprivation and weight.
And the general framework: in cases of illness, pregnancy, and medication use, decisions about nutrition should be made with a doctor, not based on a graph on your phone.
Frequently asked questions
- Is glucose monitoring necessary for a person without diabetes?
- There is no medical necessity. It can be useful as visual feedback—showing the impact of portion size, liquid carbohydrates, and a walk after a meal—but it does not replace a diagnosis and does not determine a diet on its own.
- What blood sugar fluctuations are normal for a healthy person?
- In observations of several thousand people without diabetes, the median variability was about 15%, with about 96% of the time spent in the 3.9–7.8 mmol/L range, and about 75% in the narrow 3.9–5.6 range. In other words, going outside the narrow corridor for a quarter of the day is a common pattern.
- Why does the sensor show something different from a glucometer?
- It measures glucose in the interstitial fluid, not in the blood, and it lags by about 10–15 minutes. During a rapid rise or fall, the discrepancy with a simultaneous blood test is greatest.
- Does a rise after a meal mean that a product is harmful?
- No. A rise in glucose after carbohydrate-rich food is normal metabolic function. What matters is whether the value returned to the baseline, not the height of the peak itself. The steepness depends on the composition of the dish and the presence of fat, protein, and fiber alongside it.
- Can you count calories using a sensor?
- No, these are different metrics. Fatty food barely moves the glucose curve and is the most calorie-dense, so relying on the graph can mask an energy surplus. Caloric content is calculated separately.
Read next
- Glycemic index: what it measures and when it is useless to use — Glycemic index tables look like a list of allowed and forbidden foods: buckwheat has one number, potatoes have another, and it seems straightforward from there.
- Smart scales: what bioimpedance actually measures — Smart scales display body fat percentage, water percentage, muscle mass, bone mass, and "metabolic age.
- DNA test "tailored to your genome": what is known about nutrition based on genes — The promise sounds convincing: a saliva sample, two weeks of waiting, and a diet tailored to your heredity.
This article is for general information. It is not medical advice, a diagnosis, or a prescription for treatment or a diet, and it does not replace a consultation with your doctor. If you have a health condition, are pregnant, take medication, or follow a diet prescribed to you, decisions about food belong with your doctor.
Figures from regulations, guidelines and studies are given as they stood when this article was prepared and may since have changed; check them against the primary sources. This article is not advertising, an offer, or individual advice, and neither the author nor the site owner is responsible for decisions taken on the basis of it.